Wednesday, July 29, 2015

Create your own carousel on the PWA home page!!

Hi,

The PWA homepage is really user friendly and pleasant to use since the carousels and tiles have been introduced in Project Server 2013 and Project Online. But wouldn't it be nice to create your own carousel integrating for example your own corporate links, or anything which might be relevant for your users? We can think about BI Center report librairies, document librairies, external links. This could look like this:
Figure 1: PWA homepage with your own carousel

So how to achieve it? The procedure is quite straight forward:
  1. Create a new "promoted links" app,
  2. Add your links in the "promoted links" list,
  3. Add the app to your homepage.
No more than this!! So here are some more details.

1. Create a new "promoted links" app
Click on the gear icon and select "add an app". Pick-up the "promoted links" app.
Figure 2: add the "promoted links" app
Give a relevant name to your new app since it will appear (if configured accordingly) as the title of your carousel on your PWA homepage.

2. Add your links in the "promoted links" list
Before adding your links to the list (actually this promoted links app is a list containing links), you need to add the pictures that will be used for the title. Try to use a square picture, ideally PNG format, knowing that 110*110 is the standard tile format. I personnaly used for the example the "Shared Documents" librairy.
Figure 3: add the picture for the tile
Once the picture is added, you can proceed and add the link in the promoted links list.

Figure 4: add a new link to the promoted links list
You will have some properties to fill, such as the path (URL) of the link and picture. You can previously copy the picture path to paste it at the right place. You also have to add the title and description of the link. 
Figure 5: promoted link settings
Note that you can also specify the order of the tile in case you add more than one tile in the carousel, as well as the laucn behavior (new tab, page navigation, dialog box).

3. Add the app to your homepage
Once you app is configured with your link, you have to add it to your homepage (or anywhere else where a webpart can be added, such as a project site, the BI Center...). Click on the gear icon, then "edit page", "add a webpart, select the promoted links app in the "apps" section and add it.
Figure 6: adding the promoted links app to the homepage
Finally, you can edit the webpart properties to adjust some settings, such as displaying the app title above the carousel.
Figure 7: tile added to the PWA homepage
And with a few more tiles:
Figure 8: some more tiles added to your new carousel on the PWA homepage
Et voilà!!

Share this article :

Thursday, July 23, 2015

Using target audience to prevent team members from accessing timesheet

Hi and welcome for this new blog post! 

The TechNet forums are a great source for improving our knowledge and experience since new concerns, ideas, workarounds or solutions always show up to enhance Project capabilities. Recently a user had a question about restricting timesheeting to a certain group of users. In other words, is it possible to prevent timesheet entry for a specific group? The first reply is "no", timesheet in Project Server and Project Online is a "all or none" feature as Dale Howard a fellow MVP said. A workaround I proposed subsequently consists in not enabling the "View Timesheets" global permission to a security group similar to the team member group. By the way, you can refer to this post for having all security references for Project Server versions. The description of the permission is "When this permission is denied, it prevents users from seeing the Timesheet Center link on the Project Web App Quick Launch menu". This permission does not lock down access to the Timesheet page and it is still possible for users to navigate to this page. But in addition, if you don't give access to the timesheet views to the associated category, it should prevent users in this group to submit timesheet. Well done! I've not tested it, but still, it is only a workaround, isn't it? I say workaround since it is a combination of configurations which are not intended to prevent users from doing timesheet. But put together, they more or less reach the same goal, with some weaknesses.

Then another person jumped in the thread and proposed to use the target audience. We are in a Project Server world, and evenif it is (more and more) part of the SharePoint ecosystem, we (or at least I) do not always instinctively think about exclusive SharePoint features for supporting our customer needs in terms of Project implementation.

So what is target audience and how does it work in a Project context (Project Online for my example)?

"Web Parts in Microsoft SharePoint Server can be targeted to appear only to people who are members of a particular group or audience. When you do this by editing the Web Part in the browser, SharePoint Server assigns the GUID that identifies the audience to the AuthorizationFilter property of the Web Part."

Basically you define groups (be aware that they are independant from the Project Server security groups) in the Central Admin or inthe O365 admin center. Then you edit the webpart and associate it with the given group.

Figure 1: access the O365 admin center
Once in the O365 admin center, you can access the groups section. In my Online demo tenant, I already have preconfigured groups which contain users and are gathered under distribution lists. Either you can use one of those if you already have groups or you can create a new groups.

Figure 2: edit or create group
Since I'm not a SharePoint expert, I will simply edit one the existing group and remove myself from the group (note that I have to declare another user as the group admin). Then go to the timesheet and edit the page. Select the timesheet webpart and open the properties.
Figure 3: edit the timesheet page and open the webpart settings
In the advanced settings, select your audience with authorized timesheet users, apply the change and close the page edition.
Figure 4: configure the target audience in the webpart advanced settings
Once done, if I come back to the timesheet page, here is what I got: just a blank page:
Figure 5: timesheet page for users not belonging to the authorized audiences
As an advice, I would suggest to make a combinaison of configuration for preventing a group of users from doint timesheet:
  1. Create a security group with the "View Timesheets" global permission not enabled,
  2. Configure a target audience for the timesheet webpart with authorized timesheet users.
Doing this, you ensure that the users cannot see the timesheet link in the timesheet, and in case they copy paste the timesheet page URL, they still cannot see the timesheet webpart. However note that it requires that you maintain Project Server groups AND the target audience groups, which might be tedious and increase the administrator workload.

Do you have other ways to prevent users from doing timesheet? I'll be glad to hear it, so please share your thoughts!


Share this article :

Thursday, July 16, 2015

Why the deliverable/dependency feature is almost not used?

Hi and welcome on my new post where I'll be talking about one of my recent concern.

The Sharepoint integration brought by Project Server 2007 introduces this new feature: deliverables and dependencies. At this time, I was pretty certain that it will be a strong enabler for program management and cross project communication. Strangely, almost 10 years and 3 versions later, I've hardly seen this feature used and even hardly implemented it myself in the organizations I've supported. Moreover, you'll only find few references and blogs on Internet about this feature. Here is a good one with the following description:

"Deliverables provides the ability to publish key dates to a SharePoint site and for others to consume these keys dates within their project plan. This feature helps you to manage cross project dependencies. A project manager can define deliverables within their project plan using Project Professional and have the dates automatically published to a Deliverable SharePoint list within the Project’s workspace. This allows other project manager to take dependencies on the published deliverables within their own Project Plans. When there is a change with a deliverable, such as a change in the finish date, all the project managers who have taken a dependency on the deliverable get informed of the change with the deliverable when they open their project plan. Deliverables provide a way to loosely tie projects together."

With this diagram:
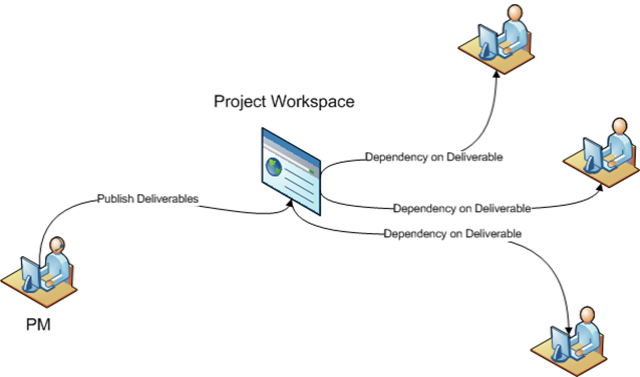
Figure 1: deliverables dependencies workflow diagram
Before this feature was released, we used to train users on the cross-project links, well explained in this blog. This feature used to be quite tedious since you had to open all projects to create the cross-project links so it had some limitations in terms of data access and security management. Also the interface for checking the external dependencies delays, accept or recept the updates was not very user-friendly. On the contrary, the new deliverables-dependencies feature was user-friendly, stored the data in the content database thus enabled easy reporting, didn't require to give access to the various project plans, let the project managers control theirs plans. Finally it is much less intrusive, meaning that you do not have "aliens" in your project plan, but you only subscribe to a Sharepoint list item. A lot of advantages I though...

So why is the cross-project link feature still often used whereas the deliverables-dependencies feature is almost never implemented? I try here to give some tracks.

1- You have to use the Sharepoint sites. 
This is the first limitation. Many organizations already have a collaborative solution. It could be an existing SharePoint tenant or another solution, but in any case, they won't use the project sites which come along the projects creation. If you read the references above, you'll see that when you create a deliverable, it will be populated in the project site deliverables list. No project site, no deliverable...
I also can add that if you use some custom columns in the develirable list from the project site, reporting on SharePoint list's custom columns is not trivial at all, evenif it is definitely doable.

2- You cannot synchronize other information than the deliverable name, and start-finish dates. 
Sadly you cannot retrieve data such as the % complete, the resource, the actual or remaining work. In one way, this can be understandable, since when a project manager subscribes to a deliverable, he/she is supposed to need only the main and relevant information, which is the finish date. But note also that a deliverable might be a task with a non-null duration, evenif it is commonly agreed that a deliverable is a milestone. In this case (where a deliverable is a task), it might be relevant to get also additionnal information. It seems like Microsoft path was to segregrate data between the publisher of the deliverable and the subscriber of the dependency. 
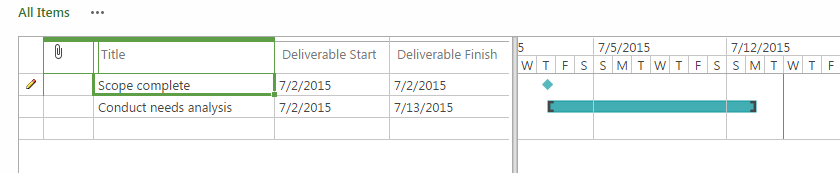
Figure 2: information synchronized between the project task and the site list deliverable

3- The panel in MS Project Pro hasn't been improved since 2007 version,
The interface of MS Project Pro encountered many evolutions since 10 years and the user experience became more and more appreciated. We saw improvments such as the backstage menu, the ribbon, the timeline, the team planner, the report tab... But those left panels such as the task inspector or the deliverables-dependencies management panel haven't changed since 2007 version. Which is quite a pity since it leads to a dropping of those features. 
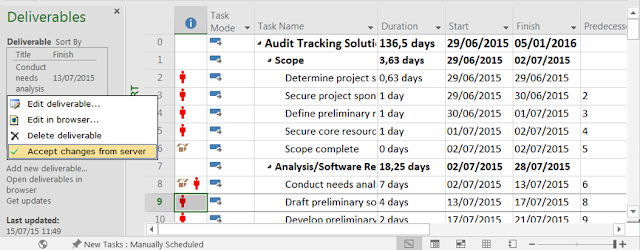
Figure 3: deliverable management panel in MS Project Pro

4- The synchronization process might be tedious and complicated to master.
How can you know if one of your dependencies is not up to date? Do you need to retrieve information from the deliverables from the server? The process might be opaque and indeed I did experience it while training users and having many questions about the process. Once learned and coached, it works like a charm, but let's face it, the deliverables-dependencies feature is intented to be used by IT friendly project managers.

Here are my thoughts and experience with cross-linking projects since 10 years. One old fashion solution quite often used and one recent solution left by the wayside. Quite paradoxal, isn't it?

What do you think? Have you ever used one feature or the other? Do you have pros and cons for both solutions? I'd like you to share with me your thoughts!

Share this article :

Friday, July 3, 2015

My first Power BI report without Excel

Hi Project addicts!

We recently had a lot of new announcements about PowerBI, embedding components such as Power Pivot, Power Query, Power Map, enabling auto refresh, etc... So I decided to roll up my sleeves and get into it with my new Project Online demo tenant. Moreover, since I'm not a developer, I'm always willing to discover reporting tools which don't require any development skills.

Funny thing (or not...), I still do not have Excel 2013, I'm stuck with an old version of Excel 2010, preventing me from installing the latest Power X add-ons to play with...

So that's it ? Obviously not, since Microsoft Power BI preview is now available, allowing you to designer powerful dashboard without even using Excel. See this reference:

So how does it work? 

First connect to https://app.powerbi.com with your O365 admin account. Once connected, you'll be able to download Power BI Designer. It is a client application which allows you connecting via odata protocol to your Project Online project data.
Figure 1: download Power BI Designer from Power BI Preview

You'll find all relevant information here:
You'll see that Power BI designer looks like Performance Point, in this old fashion presentation as well in the process of creating dashboards, eventhough it provides much more features and capabilities.

In Power BI Designer Preview

Once downloaded, you first create your odata connection on your Project Online instance. For the example, I retrieved projects data using the following URL:


Then I won't go into much details since there are many blogs explaining the process. Here is a very good one, very detailled:

Since I'm not a developer, I did a simple example, not playing too much with the query part but simply doing simple drag and drop operations and some formatting.
Here my first page:
Figure 2: dashboard's first page
And the second one:
Figure 3: dashboard's second page

Note that you have more advanced features such as the maps, or you can also edit the query if you are willing to, create relationships, measures and so one...

Once done, you can save your dashboard as a Power BI file (pbix format).

In Power BI Preview
Back in Power BI Preview, you can upload your dashboard. As you can see, uploading my dashboard from local drive to Power BI preview will create a data set, a report and a dashboard which can be shared will my colleagues.


Finally, I'll like to share 2 interesting features:

1- Q&A: you can type a question using a formal langage in order to find information based on your data set. This will return a graph with eventually a table, together with smart suggestions.

Figure 4: Q&A feature
From July 15th 2015, visualizations, Filter, and Field panes have been added to the Q&A. If I want to change the visual from line to bar chart, I just click on the bar chart icon.  Want to add a field to the visual, just click on the field or drag the field over to the appropriate location. 
Figure 5: vizualisations pane added to the Q&A

2- Schedule auto refresh: you can now schedule an odata auto refresh to keep your report up to date. See the article:
http://blogs.msdn.com/b/powerbi/archive/2015/06/22/announcing-refresh-support-for-power-bi-designer-files-in-the-power-bi-service.aspx


And just a last one for fun, where I used a "location" project custom field for a map chart in Power BI Designer to display the total projects costs by country with a slicer and a pie chart associated.
Figure 6: map chart with aa "location" project custom field, a slicer and a pie chart

Nice, isn't it?? That was just a simple example with a simple dataset and light formatting, but imagine what you could do spending a little more time on it!!

EDIT: sorry in advance for the video small size. I just tried a new capture tool and it seems like I can't get a bigger size..

Share this article :